Home Exam Structure Topics Past Papers Resources Tracker Homework About Contact

Home / Tracker

Free · works entirely in your browser

Course Tracker

One workbook covering every chapter's mini tests, end-of-topic tests and both mock papers. Download it, mark your class as you go, then upload it back here for an instant PDF progress report — per student and for the whole class. Nothing is uploaded to a server: the file is read and the report is built right here on your device.

How it works

Three steps, no sign-up

1
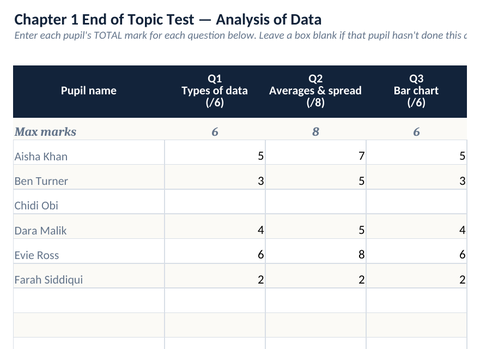
Download the tracker and mark your class's end-of-topic tests and mocks as you teach the course
2
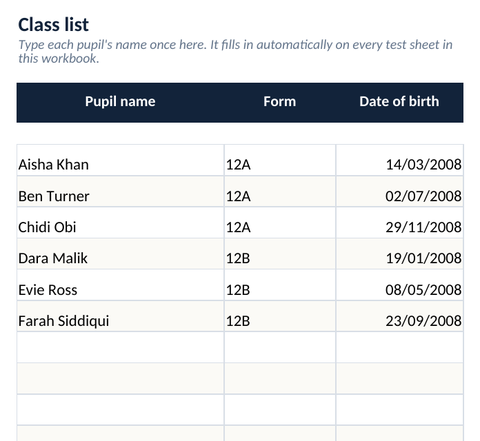
Type each pupil's name once on the Class list tab — it fills in on every other sheet automatically
3
Upload the workbook for a printable report: donut chart, top topics, best/worst topic and a predicted grade per student, plus a whole-class page

See it in action

What the workbook and the report actually look like

1

Fill in the tracker

Type each pupil's name once on the Class list tab — it appears on every test sheet automatically. Then enter marks on the end-of-topic tests and mocks as you teach them. No calculations for you to do — just numbers in boxes.
2

Upload it below

Drop the saved workbook into the box further down this page. Nothing is sent to a server — the report is built right here, in this browser tab, and your students' marks never leave your device.

Click to choose a file or drag it in

core-maths-course-tracker.xlsx

3

Get the report

A whole-class summary page, then one printable landscape page per student: a completion donut, top topics by band, the strongest and weakest topic, and a predicted grade with an explanation of how it's worked out.
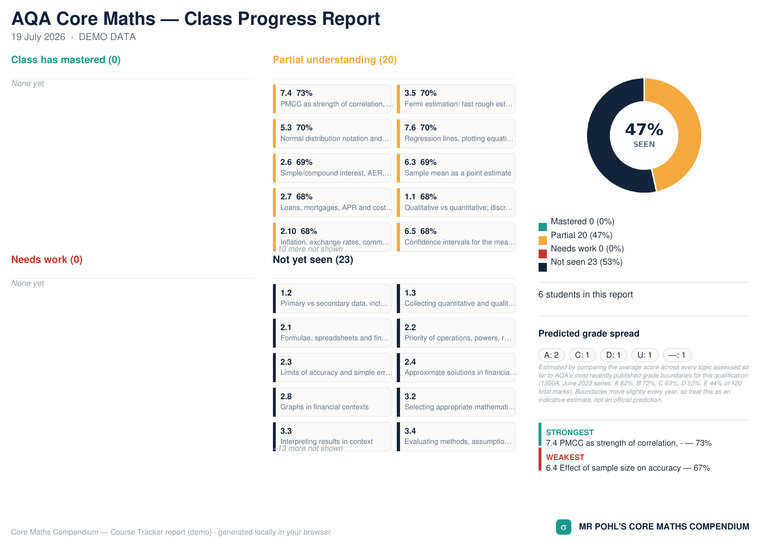
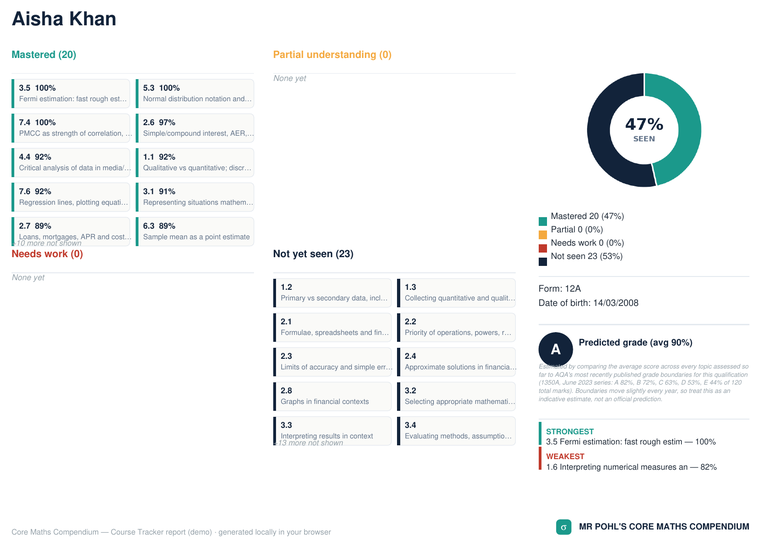
Demo data shown above — names, marks and grades are illustrative, not real pupils.

Your turn

Upload & generate the report

Upload the same workbook once you've entered some results. Blank cells are treated as "not yet seen" — you don't need to have completed every test to get a report. Everything below runs locally in this tab; your students' marks never leave your device.

Click to choose a file or drag your completed tracker workbook here

.xlsx only — the file you downloaded above, with some marks filled in

RAG key — Green = mastered (≥80% average across every question testing that topic). Amber = partial understanding (50–79%). Red = needs work (below 50%). Grey/black = not yet seen — no test question tagged to that topic has been marked for this student.